
Just within about 20 days of June this year, 20 people died with 24 people missing, and 193 families affected by landslides and floods across the country. Landslides are major disasters in Nepal and now landslide dam outburst flood (LDOF) is also challenging. Every monsoon, we embrace a chain of slope failures. They often cause cascading effects such as landslide dam formation, the collapse of the dam, flash flood, and sediment washout and aggregation. For example, the Seti river flood killed more than 70 people in 2012 while the Kali Gandaki river buried 27 buildings in the Baseri landslide in 2015.
The recent Melamchi case on June 15, 2021, is also a landslide-dam outburst flood (LDOF) scenario. Such a case highlights the dire need for preparedness across Nepal. Though the precipitation extremity from the lens of hydrometeorology is not extraordinarily large in these particular weeks, a compound interaction with sediment hazards turns these landslides into a devastating disaster.
The Melamchi menace
We show the spatial location of the Indrawati basin, consisting of Melamchi, Yangri, and Larke rivers in Figure 1. Figures 1a and 1b show the topography of the basin and the Koppen-Geiger (KG) climate classes. Due to a diverse topographic variation (629 to 6,075 m above sea level) across the Indrawati basin (catchment area = 1,228 km2), the river basin has a range of climate classes varying from temperate to polar. The river gorges and upstream catchments are highly susceptible to mass failures and soil erosion. In addition, due to a high gradient river profile, the stream power of upstream rivers is substantially increased.

Based on preliminary news reports and field consultation, it is estimated that a landslide blocked the river for about an hour. A steady decrease of water level from approximately 5 m to 3 m (with respect to the local datum) at the automatic water level monitoring station at Nakote and then a sudden increase of the water level to 6 m in a few minutes indicates a landslide dam river blockage, and outburst of the landslide dam.
Since there are no hydrometeorological stations at upstream locations, we leverage IMERG products (10 km spatial resolution and 30 min temporal resolution) to look at rainfall variability. The IMERG evaluates rainfall from the various passive microwave sensors comprising the Global Precipitation Measurement (GPM) constellation. The IMERG Early product is accessible after around four hours of observation, and the IMERG Late product after around14 hours of observation without an ultimate calibration. In contrast, the IMERG Final product is available after around 3.5 months of observation after the ultimate calibration based on monthly gauge analysis. In this assessment, we use the IMERG Late product.
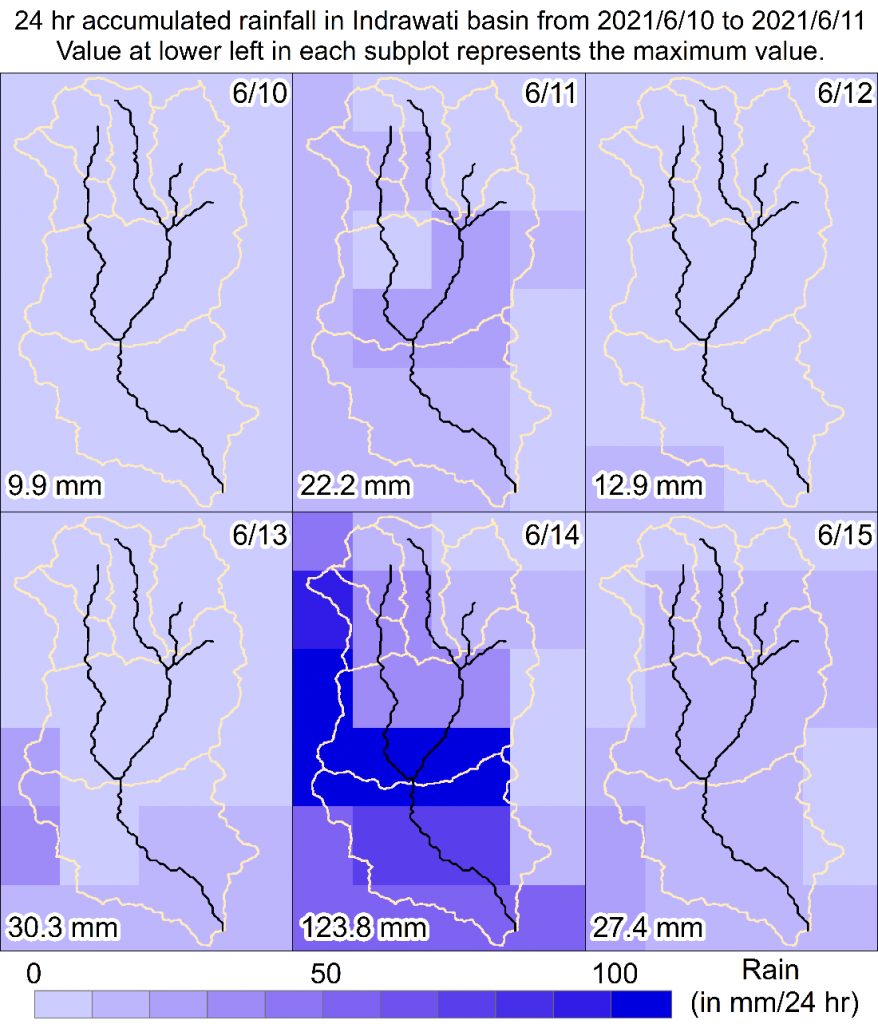
We show the spatial distribution of 24-hour accumulated rainfall across the selected study area using 28 grid points of IMERG Late products in Figure 2. We firstly aggregated the 48 half-hourly data to convert into daily rainfall at each grid. We find that about 125 mm rainfall occurred across the confluence area on June 14, 2021. On other days, there is not a significant amount of rain across the study area. However, the accumulated rain from the monsoon onset and some pre-monsoon rain could saturate the soil.
It is also possible that the 2015 earthquake has made the hill slopes unstable, and there could be cracks and fissures. A geological and geotechnical investigation would help assess the landslide susceptibility of the upstream catchments. From a hydrometeorological point of view, the event itself is not severely extreme. However, multiple factors are responsible for sediment-related hazards and subsequent flooding.
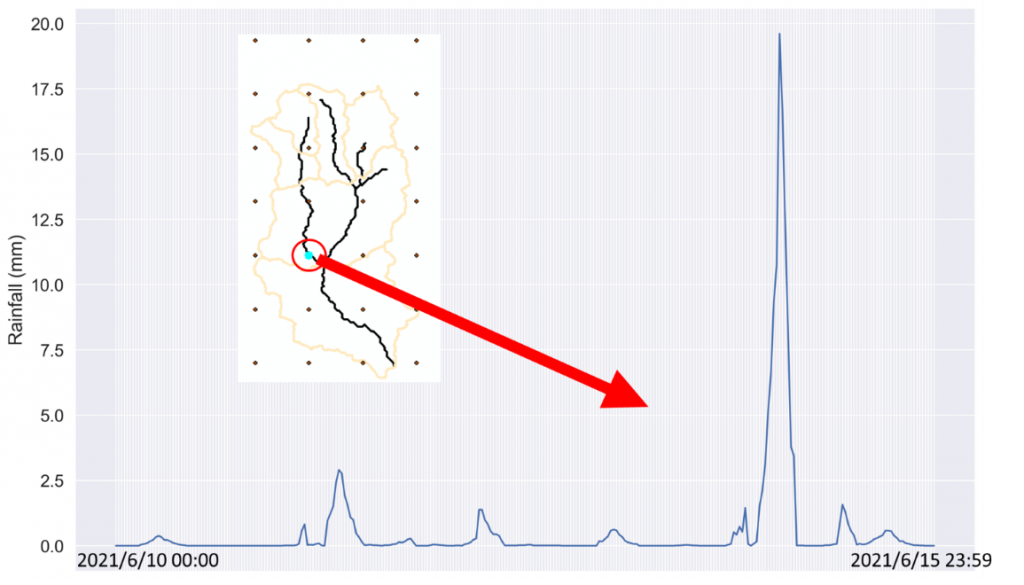
Figure 3 shows a temporal distribution of half-hourly rainfall for a grid across the Melamchi Bazaar, where more than 120 mm of 24-hour accumulated rainfall was recorded on June 14. The highest rainfall recorded is 19.61 mm in a half-hour period, normally equivalent to 40 mm/hr. The two-hour rainfall maximum rainfall is 59.27 mm, identical to 30 mm/hr intensity.
Need for early warning
This information highlights that there are no cloudburst events. The rain intensity recorded during this event is quite normal during the monsoon. Therefore, we need to be prepared for a proper early warning system that encompasses the probability of sediment and landmass movement. It is high time to analyse cascading multi-hazards. We find rainfall extremes are the promoter or carrier of such multi-hazards. However, the assessment of the rainfall threshold for multi-hazards in the Himalayan region is still challenging.
This preliminary assessment did not quantify the uncertainty associated with satellite-based rainfall estimates. These could be done by comparing with automatic weather stations or/and weather radar data. Weather radars (like X-band and S-band) can detail the likely extremeness of rainfall across the scan area. Thus, the government should expedite the proposed plan of installation of weather radars.
Rainfall-triggered landslides, if predicted ahead of time, could provide crucial information for monsoon preparedness. Here, we quickly predict the probability of rainfall-triggered landslides happening in Nepal. We use a “machine learning” model – where the machine learns from the landslides that happened in various locations and tries to find a common pattern – and using that common pattern, the model tries to predict the probability of future landslide occurrence in these locations.
Role of other variables
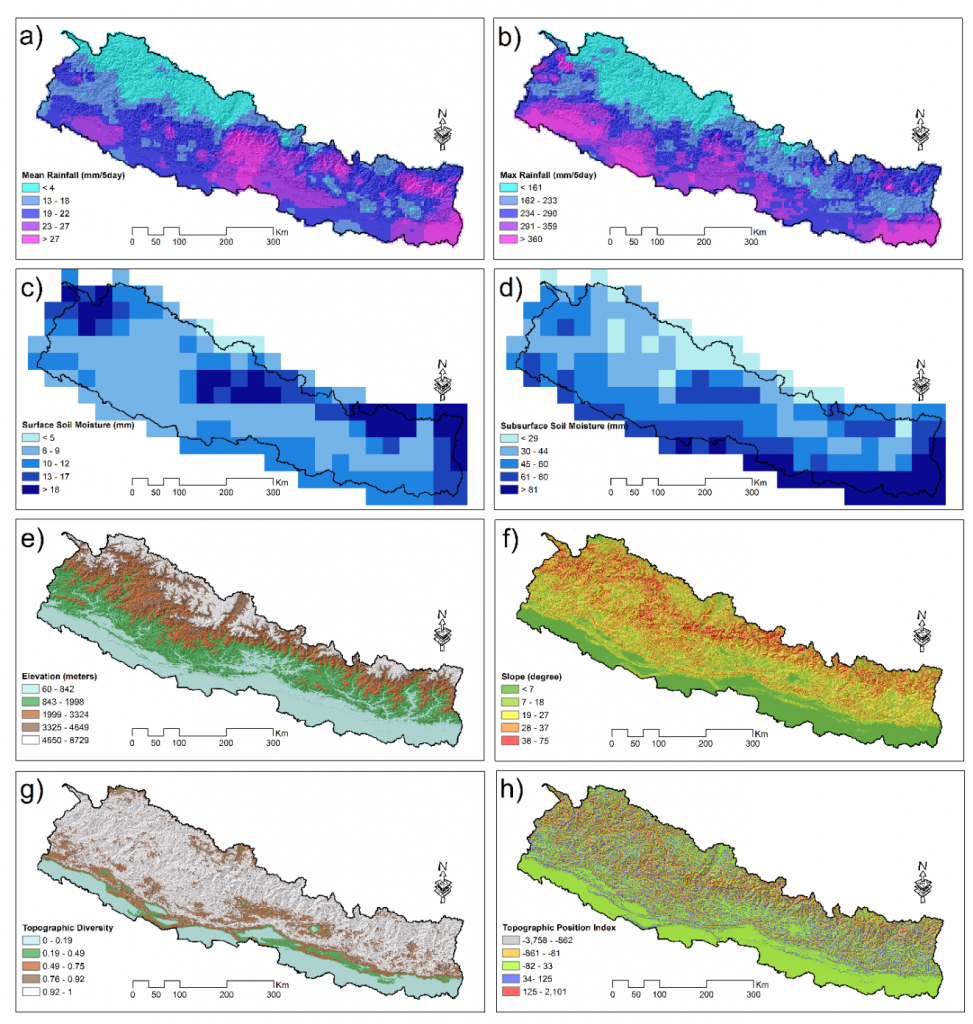
Figure 4 depicts the distribution of several environmental variables, including rainfall, soil moisture, and topographical data across Nepal. These distinctions/variations reveal various characteristics and their distribution. We can observe where there is more rainfall and where there is maximum rainfall. These variables influence general changes in regions; however, other information such as geology and soil type are critical to comprehend these variances properly. Also, precise data are available for a local scale analysis. We plan to conduct a detailed landslide susceptibility mapping for the Indrawati basin in the coming days.
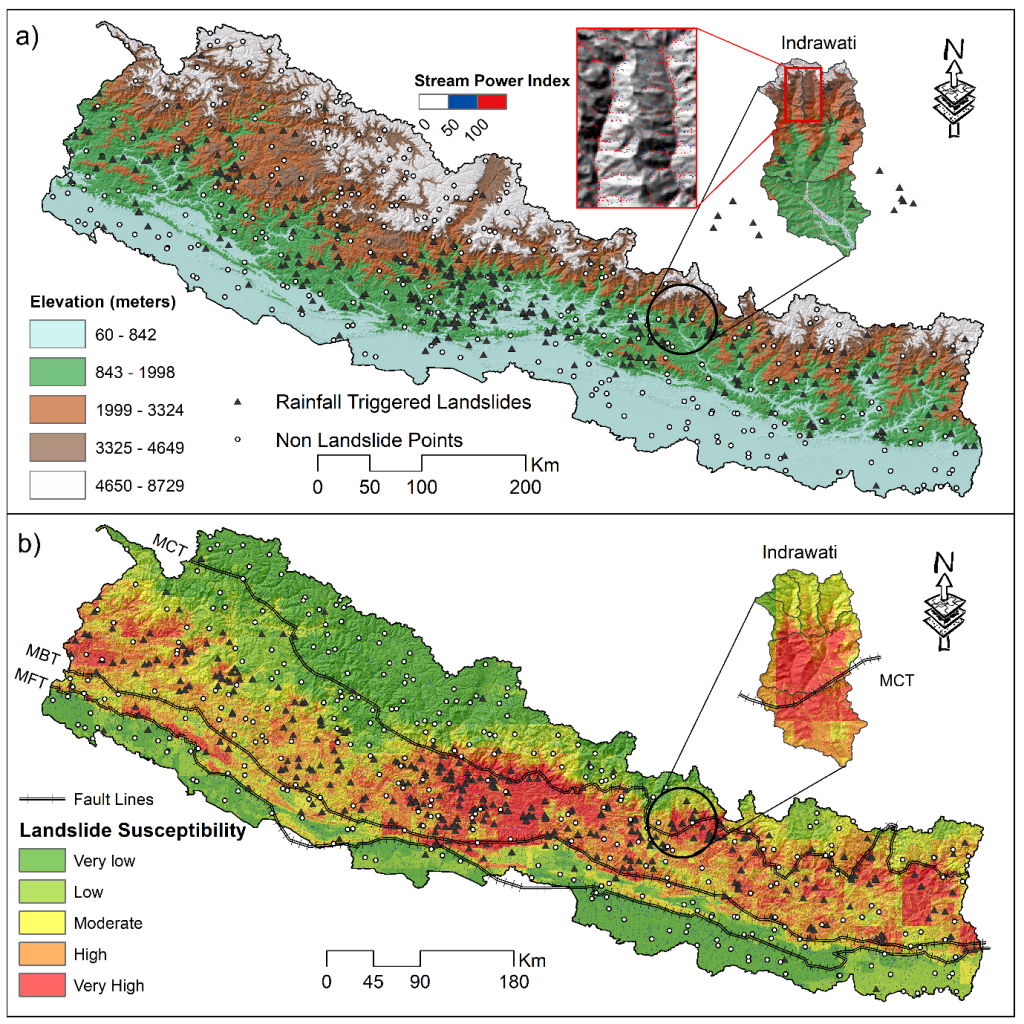
Figure 5 depicts the susceptibility of Nepal to rainfall-induced landslides. We show the Indrawati basin in an inset. We also find stream power of the upstream rivers is substantially high that could erode the sediment across its path. In addition, we can see how prone central Nepal is to landslides. We should monitor these red zones on a timely basis and be prepared for any event that may happen in near future. The landslide near the river causes the landslide damming – for that, we have to look closely at the drainage path passing through the high susceptible zone. Such information is helpful for disaster mitigation planning, establishing response teams, early warning systems, all of which will assist in reducing losses. We need to be careful about the river stage that could decline these mountainous regions, as they could be due to river blockage by landslides.
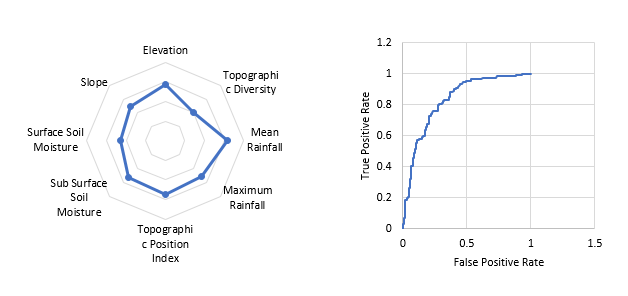
Figure 6a shows the correlation of environmental factors (Figure 3) with rainfall-triggered landslides. The mean rainfall has a higher correlation, meaning landslides tend to occur in a high-rainfall zone. Similarly, elevation, subsurface soil moisture and topographic position index have higher importance. Figure 6b shows a plot of false-positive rate vs true positive rate – these are matrices used to validate the machine learning with an independent dataset. The area under the curve is considered as the prediction capacity of the model. We achieve an acceptable area under curve score (0.83) for this model, meaning the model performs well in predicting the probability of rainfall-triggered landslides. We could improve the model predictability by analysing other controlling factors.
Disaster preparedness saves both lives and money: every dollar spent on mitigation saves more than $6 in recovery costs. We provide some quick results from the preliminary analysis. These preliminary results can be obtained by requesting a corresponding author. These are quick results and have several limitations. First, data provided in Global Landslide Catalog, NASA are spatially inconsistent. Second, a satellite-based dataset may not provide actual values (rainfall and soil moisture) or need some corrections. Lastly, we did not include the landslide triggered by the 2015 Gorkha earthquake (which weakened the terrain) also we do not have geology and soil type information in Nepal, particularly in the Himalayan region. We plan to extend this work in the near future and come up with evidence that might help us to live with landslides in Nepal.
The writers are engineers. Corresponding emails: geokshitij@gmail.com; rocky.ioe@gmail.com; bthapa.ioe@gmail.com